PHP Graph: Generate charts to display as images in Web pages
| Recommend this page to a friend! |
| Info | Example | Screenshots | Reputation | Support forum | Blog | Links |
| Ratings | Unique User Downloads | Download Rankings | ||||
| Not enough user ratings | Total: 257 | All time: 7,840 This week: 52 | ||||
| Version | License | PHP version | Categories | |||
| graph-php 1.0.1 | GNU General Publi... | 5 | HTML, PHP 5, Graphics, Statistics |
| Description | Author | |||||||||
This package can generate charts to display as images on Web pages. |
|


Example
<?php |
Details
Graph-PHP Graph charts in PHP
graph charts, graph bars, histograms, graph lines, scratter, marks
V 1.0.1
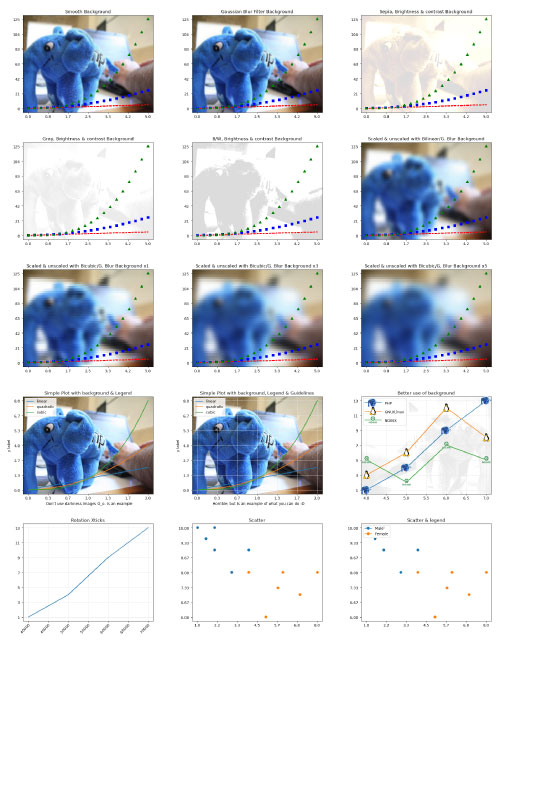
CREATE GRAPHS IN PHP:
You can create graphs charts with bars, graphs lines with marks, graphs with background images, histograms, ....
SCREENSHOTS:

Nice line graph display with markers

Graph Bars & lines

Nice Math line graph
And now some group of samples:

# REQUERIMENTS:
Requires packages:
img2img (https://github.com/vivesweb/img2img)
ext-op-ml-php (https://github.com/vivesweb/ext_op_ml)
Requires DeJaVu Fonts: (https://travis-ci.org/dejavu-fonts/dejavu-fonts)
- A minimum (minimum, minimum, minimum requeriments is needed). Tested on:
- Simple Raspberry pi (B + 512MB 700 MHz ARM11) with Raspbian Lite PHP7.3 (i love this gadgets) :heart_eyes:
- VirtualBox Ubuntu Server 20.04.2 LTS (Focal Fossa) with PHP7.4.3
- Red Hat Enterprise Linux Server release 6.10 (Santiago) PHP Version 7.3.25 (Production Server) 512Mb Memory Limit
- Red Hat Enterprise Linux release 8.4 (Ootpa). PHP Version 8.0.11 (Production Server) 512Mb Memory Limit
# SERVER REQUERIMENTS:
- PHP with GD enabled: sudo apt install php-gd

- img2img class: If you need to use IMG_FILTER_SCATTER you need at least PHP >= PHP7.4.0. See official doc: https://www.php.net/manual/en/function.imagefilter.php

- PHP with Imagick for some functions. It is not required for by most methods, but in some, like reading pdf or psd, you will need it. Install: sudo apt install php-imagick

- Requires for Instagram background effects: https://github.com/zaachi/PHP-Instagram-effects
FILES:
graph-php.class.php -> Main File.
example.php -> Example File.
# INSTALLATION: A lot of easy :smiley:. It is written in PURE PHP. Only need to include the files. Tested on basic PHP installation
require_once( 'graph-php.class.php' );
# NOTES: Before draw the Graph, first we need to prepare values inside (as type bar, lines, etc....)
RESUME OF METHODS:
- CREATE GRAPH OBJECT:
$graph = new graph( $cfg=null );
default $cfg:
[
'width'     => 6.4, // 6.4 inches
    'height'    => 4.8, // 4.8 inches
    'dpi'       => 100, // 100 dpis
    'padding'   => .6, // 0.6 inches
    'fontdir'   => __DIR__.'/fonts',
    'fontfamilypath' => 'dejavu-fonts-ttf-2.37/ttf',
    'font'      => 'DejaVuSans.ttf',
    'fontsize'  => 10.5,
    'xtickfontsize'  => 10.5,
    'ytickfontsize'  => 10.5,
    'axes'      => [ 'prop_cycle' => []
        ],
    'lines'     =>
        ['width' => 3],
    'values'     => [],
    'x_values'     => [],
    'y_values'     => [],
    'ylabel'    => '',
    'xlabel'    => '',
    'title'     => '',
    'cycler'    => [
        'color' => [
            'default' => ['#1f77b4', '#ff7f0e', '#2ca02c', '#d62728', '#9467bd', '#8c564b', '#e377c2', '#7f7f7f', '#bcbd22', '#17becf']
            ],
        'linestyle'  => [ '-', '--', ':', '-.' ]
        ],
    'backgroundstyle'       => 'solid',
    'backgroundcolor'       => '#ffffff',
    'bordertype'            => 'square',
    'paddingleft'           => .79,
    'paddingright'          => .63,
    'paddingtop'            => .58,
    'paddingbottom'         => .515,
    'paddinginsideleft'     => .2,
    'paddinginsideright'    => .2,
    'paddinginsidetop'      => .15,
    'paddinginsidebottom'   => .15,
    'ymarginleftlabel'      => 10,
    'xmarginlabelsticks'    => 16,
    'ymarginlabelsticks'    => 10,
    'xshowlabelticks'       => true,
    'yshowlabelticks'       => true,
    'margintitle'           => 50,
    'x_drawguidelines'      => false,
    'y_drawguidelines'      => false,
	'centerlabels'			=> false,
	'bars'	                => ['percmarginbetwbars' => 20 ],
	'legend'			    => false,
	'legendmarginleft'		=> 7,
    'legendmargintop'		=> 6,
    'legendpaddingleft'		=> 5,
    'legendpaddingtop'		=> 1,
    'legendpaddingright'	=> 5,
    'legendpaddingbottom'	=> 3,
    'legendwidthlines'	    => 28,
    'legendlabelheight'     => 21,
	'width_marker_x'		=> 9,
	'height_marker_x'		=> 9,
	'width_marker_o'		=> 10,
	'height_marker_o'		=> 10,
    'xticks'                => ['rotation' => 0]

]; // /$default_cfg
Example:
$graph = new graph();
- PREPARE BAR GRAPH:
$graph->bar( $array_values, $arr_values_y_param = null, $cfg = null );
This method prepare a serie of values in BAR format. Do not echo the graph. To see how to echo graph, see output_gd_png_base64() method.
$array_values: Values of Axis X
$arr_values_y_param: Values of Axis Y. If not given, each $array_values will be the Axys Y values and each value will be an index position in Axis X automatically
$cfg: *see CFG_GRAPH_TYPES
Example:
  $graph = new graph();
  $graph->bar( [1, 2, 3, 4] );
  echo '<img src="'.$graph->output_gd_png_base64( ).'" >'; // Echo img raw data in html page
With this simple code you will generate the most simplest graph:

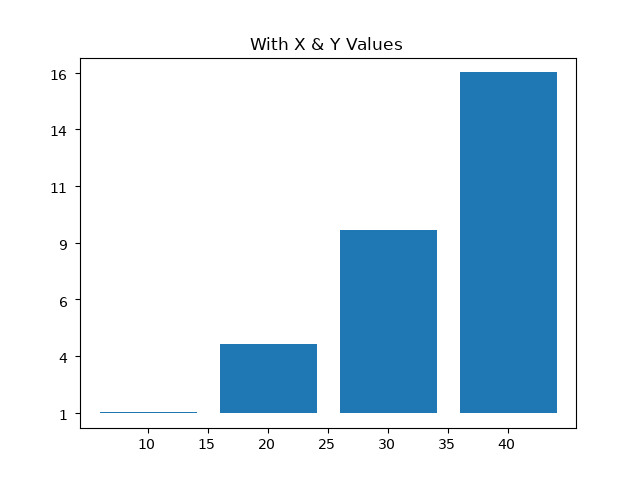
Example with x & y values:
  $graph = new graph();
  $graph->bar( [10, 20, 30, 40], [1, 4, 9, 16] );
  $graph->title("With X & Y Values"); // Set the title of the bar. See title() method
  echo '<img src="'.$graph->output_gd_png_base64( ).'" >'; // Echo img raw data in html page
With this simple code you will generate the most simplest graph:
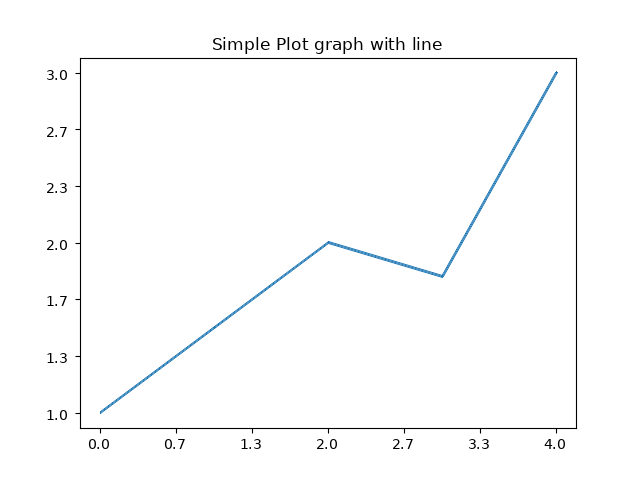
- PREPARE LINE GRAPH:
$graph->plot( $array_values, $arr_values_y_param = null, $cfg = null );
This method prepare a serie of values in LINES format. Do not echo the graph. To see how to echo graph, see output_gd_png_base64() method.
$array_values: Values of Axis X
$arr_values_y_param: Values of Axis Y. If not given, each $array_values will be the Axys Y values and each value will be an index position in Axis X automatically
$cfg: *see CFG_GRAPH_TYPES
Example:
  $graph = new graph();
  $graph->plot( [1, 1.5, 2, 1.8, 3] );
  $graph->title("Simple Plot graph with line"); // Set the title of the bar. See title() method
  echo '<img src="'.$graph->output_gd_png_base64( ).'" >'; // Echo img raw data in html page
With this simple code you will generate the most simplest line graph:
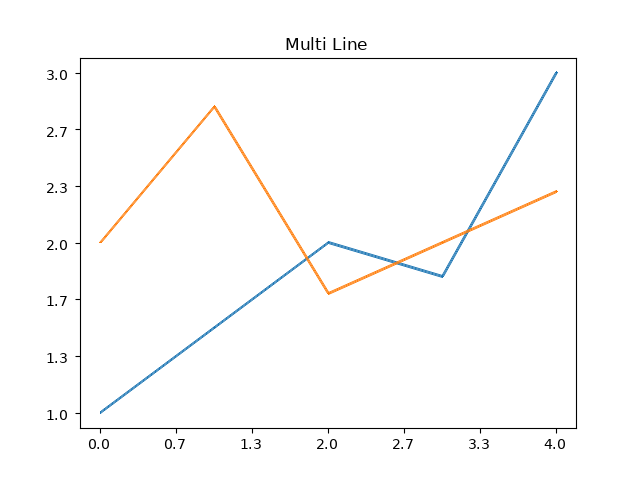
- PREPARE MULTILINE GRAPH:
You can prepare multilines calling plot() method as many series as you need.
Example:
  $graph = new graph();
  $graph->plot( [1, 1.5, 2, 1.8, 3] );
  $graph->plot( [2, 2.8, 1.7, 2, 2.3] );
  $graph->title("Multi Line"); // Set the title of the bar. See title() method
  echo '<img src="'.$graph->output_gd_png_base64( ).'" >'; // Echo img raw data in html page
With this simple code you will generate Multiline Graph:
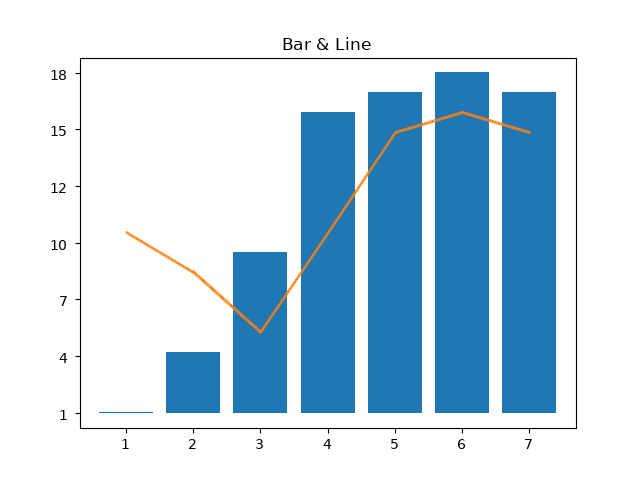
- MERGE LINES & BAR GRAPH:
You can merge line/multilines & bars calling plot()/bar() method as many series as you need.
Example:
  $graph = new graph();
  $graph->bar( [1, 2, 3, 4, 5, 6, 7], [1, 4, 9, 16, 17, 18, 17] );
  $graph->plot( [1, 2, 3, 4, 5, 6, 7], [10,8, 5, 10,15, 16, 15] );
  $graph->title( 'Bar & Line' ); // Set the title of the bar. See title() method
  echo '<img src="'.$graph->output_gd_png_base64( ).'" >'; // Echo img raw data in html page
With this simple code you will generate Line & Bar Graph:
- SET GRAPH TITLE:
$graph->title( $title );
$graph->set_title( $title ); // synonymous of title()
This method set the graph TITLE
$title: String with the title
Example:
  $graph = new graph();
  $graph->bar( [1, 2, 3, 4] );
  $graph->title("Here your graph TITLE");
  echo '<img src="'.$graph->output_gd_png_base64( ).'" >'; // Echo img raw data in html page
With this simple code you will generate Simple Bar graph with title:

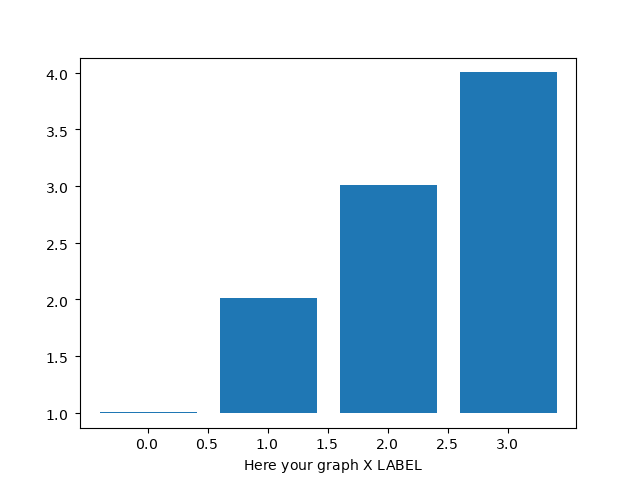
- SET GRAPH X LABEL:
$graph->xlabel( $xlabel );
$graph->set_xlabel( $xlabel ); // synonymous of xlabel()
This method set the graph X LABEL
$xlabel: String with the X LABEL
Example:
  $graph = new graph();
  $graph->bar( [1, 2, 3, 4] );
  $graph->xlabel( 'Here your graph X LABEL' );
  echo '<img src="'.$graph->output_gd_png_base64( ).'" >'; // Echo img raw data in html page
With this simple code you will generate Simple Bar graph with X label:
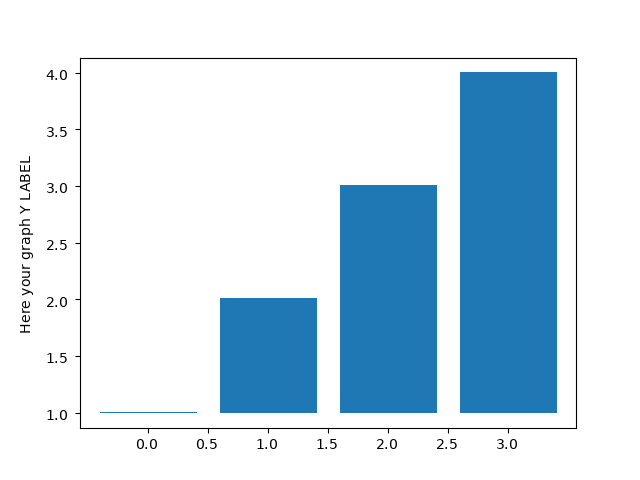
- SET GRAPH Y LABEL:
$graph->ylabel( $ylabel );
$graph->set_ylabel( $ylabel ); // synonymous of ylabel()
This method set the graph Y LABEL
$ylabel: String with the Y LABEL
Example:
  $graph = new graph();
  $graph->bar( [1, 2, 3, 4] );
  $graph->ylabel( 'Here your graph Y LABEL' );
  echo '<img src="'.$graph->output_gd_png_base64( ).'" >'; // Echo img raw data in html page
With this simple code you will generate Simple Bar graph with Y label:
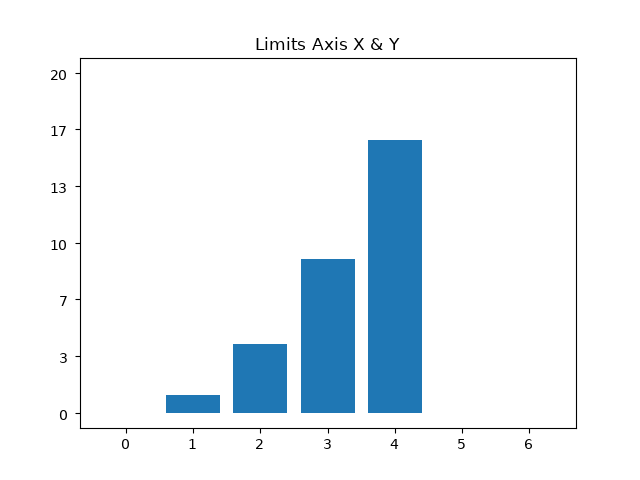
- LIMIT AXES VALUES:
$graph->axes( $xmin, $xmax, $ymin, $ymax );
$graph->axes( $arr_min_max );
This method set the min & max values of axis X & Y
You can send each value separatelly with
$xmin: Minimum Value for Axis X
$xmax: Maximum Value for Axis X
$ymin: Minimum Value for Axis Y
$ymax: Maximum Value for Axis Y
If you prefer, you can send the params in one array as:
$arr_params = [$xmin, $xmax, $ymin, $ymax]
If any of params is NULL, then the system will select it automatically
Example:
  $graph = new graph();
  $graph->bar( [1, 2, 3, 4], [1, 4, 9, 16] );
  $arr_params = [0, 6, 0, 20];
  $graph->axes($arr_params); // Same as $graph->axes(0, 6, 0, 20);
  $graph->title("Limits Axis X & Y"); // Set the Title
  echo '<img src="'.$graph->output_gd_png_base64( ).'" >'; // Echo img raw data in html page
With this simple code you will generate Simple Bar graph with limits in X & Y axis:
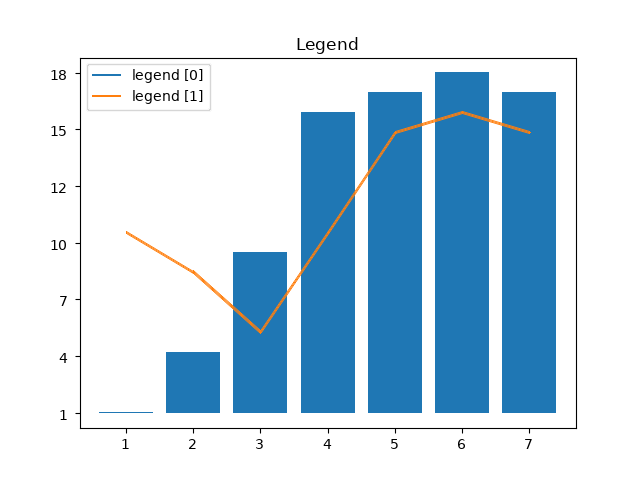
- SHOW LEGEND:
$graph->legend( $legend = true );
Calling this method the graph show the legend. You can set it to false to hide the legend. By default the legend is not showed.
By default, the title of each serie to show in legend will be the index of the serie. You can set the name of the title with $cfg param whe call bar(), plot() methods
Example:
$graph->bar( [1, 2, 3, 4, 5, 6, 7], [1, 4, 9, 16, 17, 18, 17] );
$graph->plot( [1, 2, 3, 4, 5, 6, 7], [10,8, 5, 10,15, 16, 15] );
$graph->title( 'Legend' );
$graph->legend( );
echo '<img src="'.$graph->output_gd_png_base64( ).'" >'; // Echo img raw data in html page
With this simple code you will generate Graph with legend:
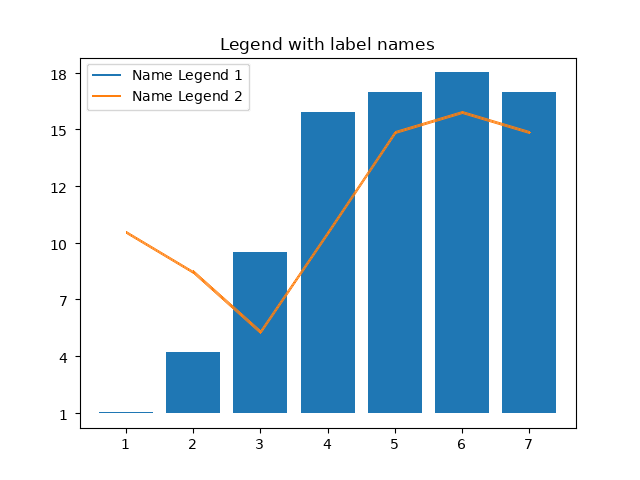
Example with legend names:
$graph->bar( [1, 2, 3, 4, 5, 6, 7], [1, 4, 9, 16, 17, 18, 17], ['label'=>'Name Legend 1'] );
$graph->plot( [1, 2, 3, 4, 5, 6, 7], [10,8, 5, 10,15, 16, 15], ['label'=>'Name Legend 2'] );
$graph->title( 'Legend with label names' );
$graph->legend( );
echo '<img src="'.$graph->output_gd_png_base64( ).'" >'; // Echo img raw data in html page
With this simple code you will generate Graph with legend:
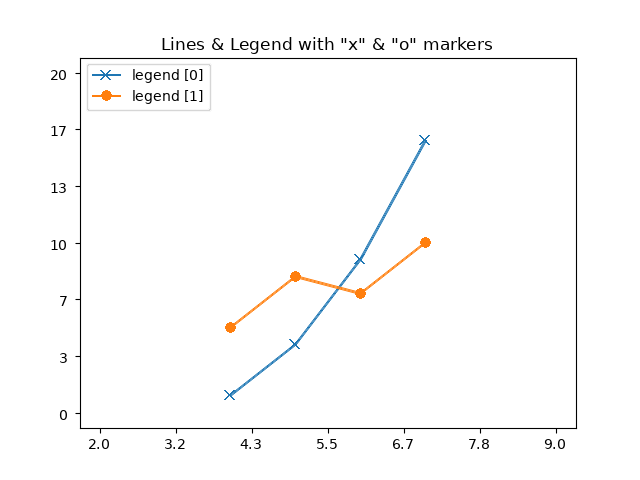
- MARKERS:
When plot a line or bar, you can send a param marker. Markers allowed: 'x', 'o', 'd', '^', 's'
*See USING LINES, COLORS & MARKERS.
Example:
$graph->plot( [4, 5, 6, 7], [1, 4, 9, 16], ['marker' => 'x'] );
$graph->plot( [4, 5, 6, 7], [5, 8, 7, 10], ['marker' => 'o'] );
$graph->axes([2, 9, 0, 20]);
$graph->title( 'Lines & Legend with "x" & "o" markers' );
$graph->legend( );
echo '<img src="'.$graph->output_gd_png_base64( ).'" >'; // Echo img raw data in html page
With this simple code you will generate Graph with markers:
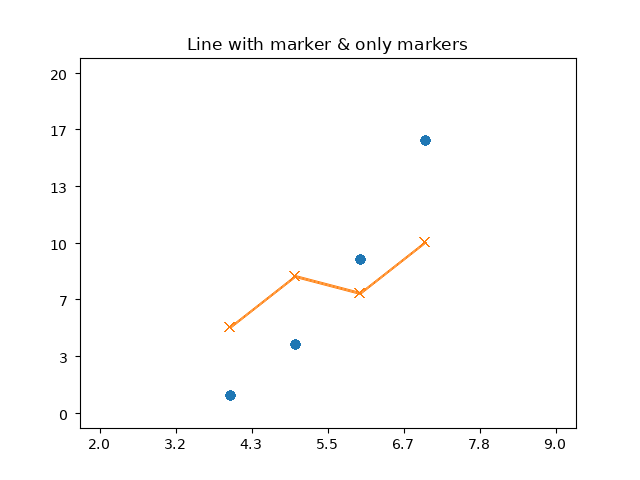
You can pass directly the marker and format line. Example of use with line with marker and only marker:
$graph->plot( [4, 5, 6, 7], [1, 4, 9, 16], 'o' );
$graph->plot( [4, 5, 6, 7], [5, 8, 7, 10], 'x-' );
$graph->axes([2, 9, 0, 20]);
$graph->title( 'Line with marker & only markers' );
echo '<img src="'.$graph->output_gd_png_base64( ).'" >'; // Echo img raw data in html page
With this simple code you will generate Graph with markers and serie with marker and line:
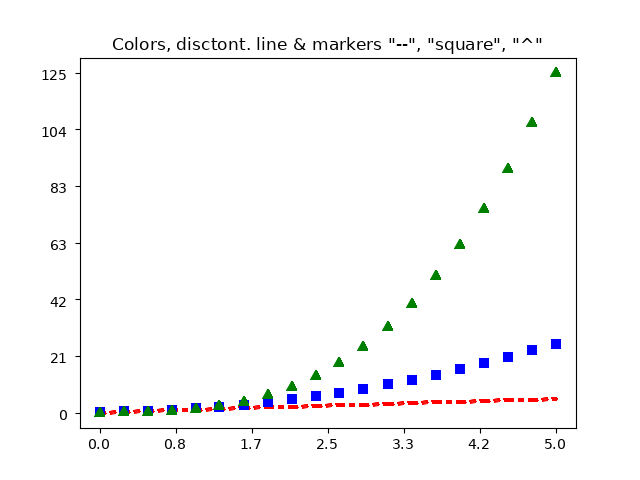
- PASS MORE THAN 1 PLOT VALUES, COLORS & MARKERS:
In 1 simple row you can pass more than 1 array of values with colors & markers. See USING LINES, COLORS & MARKERS:
$graph = new graph();
$x = $graph->math->linspace( 0, 5, 20 );
$graph->plot( [ [$x, $x, 'r--'], [$x, $graph->math->pow($x, 2), 'bs'], [$x, $graph->math->pow($x, 3), 'g^'] ] );
$graph->title( 'Colors, disctont. line & markers "--", "square", "^"' );
echo '<img src="'.$graph->output_gd_png_base64( ).'" >'; // Echo img raw data in html page
With this simple code you will generate Graph with mutiple values, colors & markers:
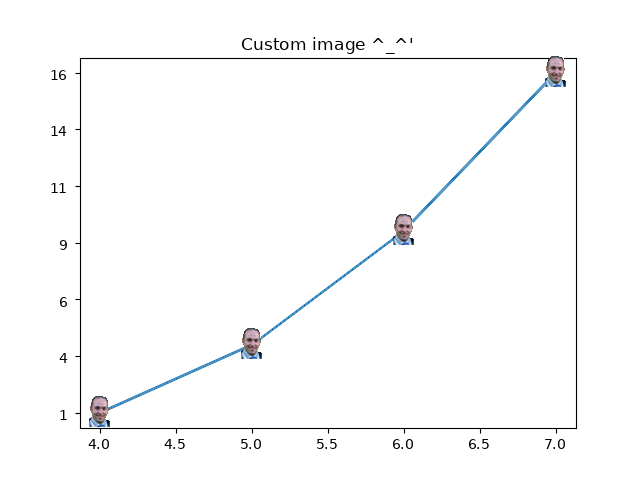
- CUSTOM PNG MARKERS:
You can use your custom PNG markers. The file need to be .png file (NOTE: ONLY WORKS WITH PNG-8. Don't work with PNG-24)
Example:
$graph->plot( [4, 5, 6, 7], [1, 4, 9, 16], ['marker' => __DIR__ . '/author.png',] );
$graph->title( 'Custom image ^_^\'' );
echo '<img src="'.$graph->output_gd_png_base64( ).'" >'; // Echo img raw data in html page
With this simple code you will generate Graph with custom markers:
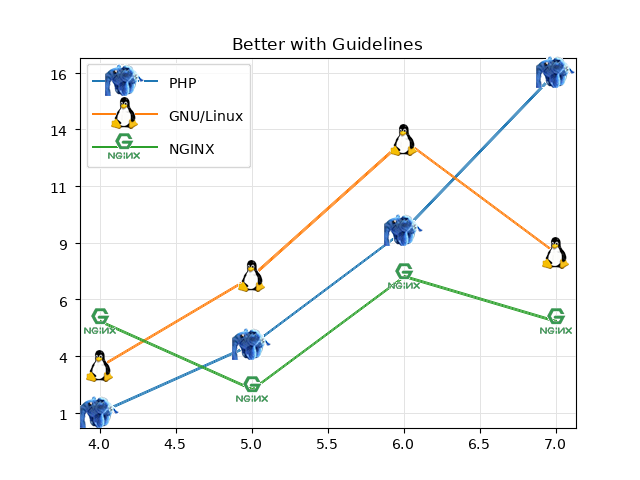
- SHOW GUIDELINES:
You can use background guidelines
$graph->set_drawguidelines( $show=true );
Example:
$graph->plot( [4, 5, 6, 7], [1, 4, 9, 16], ['marker' => __DIR__ . '/custom_marker.png', 'label'=>'PHP'] );
$graph->plot( [4, 5, 6, 7], [3, 7, 13, 8], ['marker' => __DIR__ . '/tux.png', 'label'=>'GNU/Linux'] );
$graph->plot( [4, 5, 6, 7], [5, 2, 7, 5], ['marker' => __DIR__ . '/nginx.png', 'label'=>'NGINX'] );
$graph->set_drawguidelines( );
$graph->legendwidthlines( 65 ); // Change width of legend lines
$graph->legendlabelheight( 33 ); // Change height of legend labels
$graph->title( 'Better with Guidelines' );
$graph->legend( );
echo '<img src="'.$graph->output_gd_png_base64( ).'" >'; // Echo img raw data in html page
With this simple code you will generate Graph with custom markers & Guidelines:
- SHOW X GUIDELINES:
You can show only background X guidelines
$graph->set_x_drawguidelines( $show=true );
Example:
$graph->set_x_drawguidelines( );
- SHOW Y GUIDELINES:
You can show only background Y guidelines
$graph->set_y_drawguidelines( $show=true );
Example:
$graph->set_y_drawguidelines( );
- CHANGE LINE WIDTH OF LEGEND:
Sometimes you will need to change the width of the series line at Legend. You can to set the with legendwidthlines()
$graph->legendwidthlines( $legendwidthlines=28 );
See example at SHOW GUIDELINES
- CHANGE LABEL HEIGHT OF LEGEND:
Sometimes you will need to change the height of the labe series line at Legend. You can to set the with legendlabelheight()
$graph->legendlabelheight( $legendlabelheight=21 );
See example at SHOW GUIDELINES
- SET BACKGROUND IMAGE:
You can set a background image. Support .jpg, .png, .gif. The class that load the image is img2img (https://github.com/vivesweb/img2img). See the documentation for possibilites
$graph->imread( $filename );
Example:
$graph = new graph();
$graph->imread( __DIR__ .'/background_example.jpg');
$x = $graph->math->linspace( 0, 5, 20 );
$graph->title( 'Original Background' );
$graph->plot( [ [$x, $x, 'r--'], [$x, $graph->math->pow($x, 2), 'bs'], [$x, $graph->math->pow($x, 3), 'g^'] ] );
echo '<img src="'.$graph->output_gd_png_base64( ).'" >'; // Echo img raw data in html page
With this simple code you will generate Graph with background image:
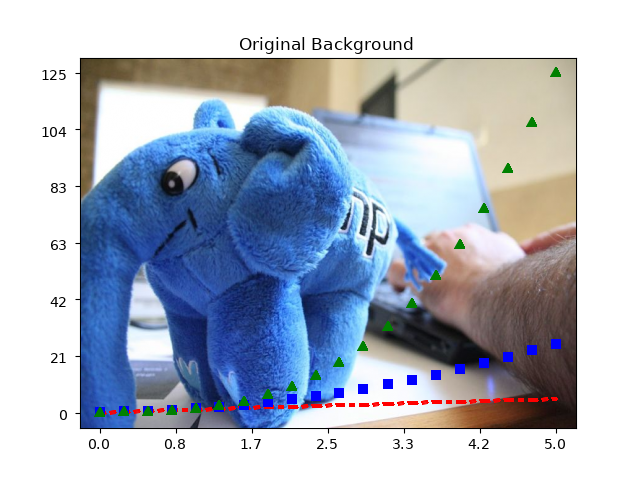
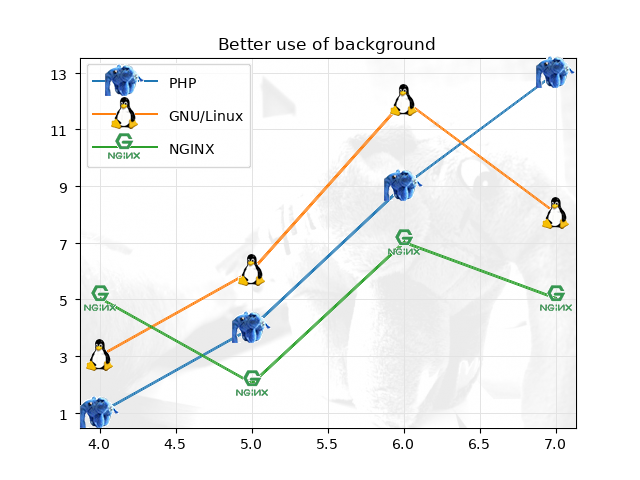
Is not a good idea use original image. You will need to transform it to more clearer picture. With the img2img class you can transform it directly. img2img (https://github.com/vivesweb/img2img). See the documentation for possibilites. You can see https://github.com/vivesweb/graph-php/blob/main/example.php to take some ideas for its use.
The class of img2img is loaded at $graph->bckgr_img_gd. You can use directly the methods of img2img. See the next example.
Example with cleared background image:
$graph->plot( [4, 5, 6, 7], [1, 4, 9, 13], ['marker' => __DIR__ . '/custom_marker.png', 'label'=>'PHP'] );
$graph->plot( [4, 5, 6, 7], [3, 6, 12, 8], ['marker' => __DIR__ . '/tux.png', 'label'=>'GNU/Linux'] );
$graph->plot( [4, 5, 6, 7], [5, 2, 7, 5], ['marker' => __DIR__ . '/nginx.png', 'label'=>'NGINX'] );
$graph->legendwidthlines( 65 );
$graph->legendlabelheight( 33 );
$graph->imread( __DIR__ .'/background_example.jpg');
$graph->title( 'Better use of background' );
$graph->set_drawguidelines( );
$graph->bckgr_img_gd->filter( IMG_FILTER_GRAYSCALE );
$graph->bckgr_img_gd->filter( IMG_FILTER_BRIGHTNESS, -50 );
$graph->bckgr_img_gd->filter( IMG_FILTER_BRIGHTNESS, 100 );
$graph->bckgr_img_gd->filter( IMG_FILTER_CONTRAST, 50 );
$graph->bckgr_img_gd->filter( IMG_FILTER_BRIGHTNESS, 115 );
$graph->bckgr_img_gd->flip( );
$graph->legend();
echo '<img src="'.$graph->output_gd_png_base64( ).'" >'; // Echo img raw data in html page
With this simple code you will generate Graph with cleared background image:
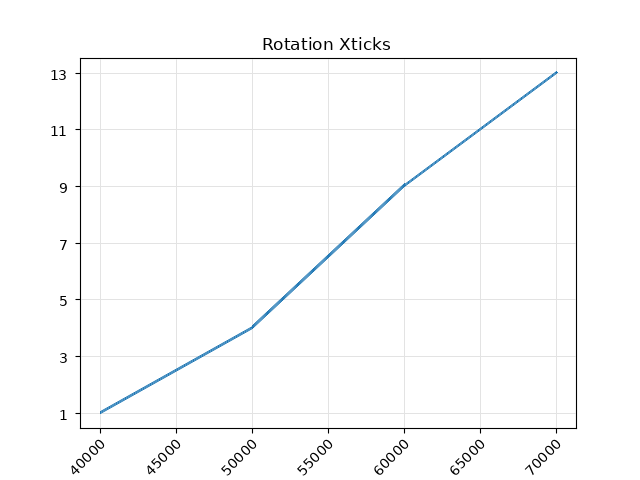
- ROTATE TICKS X LABELS:
You can rotate text on X Axis labels. In this case we use 45�. if you want original horizontal, set rotation to 0.
$graph->xticks( ['rotation' => 45] );
Example:
$graph->plot( [40000, 50000, 60000, 70000], [1, 4, 9, 13] );
$graph->title( 'Rotation Xticks' );
$graph->set_drawguidelines( );
$graph->xticks( ['rotation' => 45]);
echo '<img src="'.$graph->output_gd_png_base64( ).'" >'; // Echo img raw data in html page
With this simple code you will generate Graph with rotation X labels:
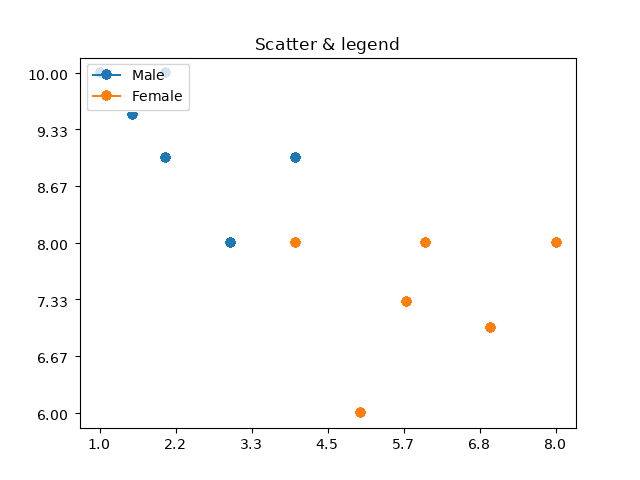
- SCATTER:
You can create a Scatter Graph.
$graph->scatter( $arr_values );
$arr_values will be as:
$arr_values = [
	[ [1, 1.5, 2, 2, 3, 4], [10, 9.5, 9, 10, 8, 9] ], // For Serie 1 [ [x_arrayvalues], [y_arrayvalues] ]
    	[ [4, 5, 5.7, 6, 7, 8], [8, 6, 7.3, 8, 7, 8] ], // For Serie 2 [ [x_arrayvalues], [y_arrayvalues] ]
]
If you want labels on Legend, use this:
$arr_values = [
	[ [1, 1.5, 2, 2, 3, 4], [10, 9.5, 9, 10, 8, 9], ['label'=>'Male'] ],
	[ [4, 5, 5.7, 6, 7, 8], [8, 6, 7.3, 8, 7, 8], ['label'=>'Female'] ],
];
Example:
$arr_values = [
		[ [1, 1.5, 2, 2, 3, 4], [10, 9.5, 9, 10, 8, 9], ['label'=>'Male'] ],
		[ [4, 5, 5.7, 6, 7, 8], [8, 6, 7.3, 8, 7, 8], ['label'=>'Female'] ],
];

$graph->title( 'Scatter & legend' );
$graph->scatter( $arr_values );
$graph->legend( );
echo '<img src="'.$graph->output_gd_png_base64( ).'" >'; // Echo img raw data in html page
With this simple code you will generate Scatter Graph:
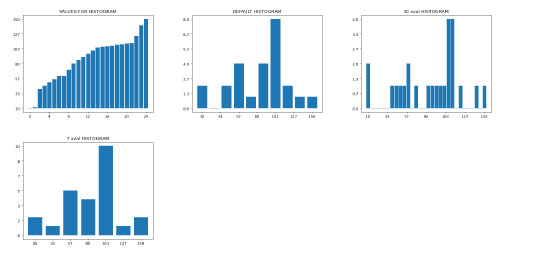
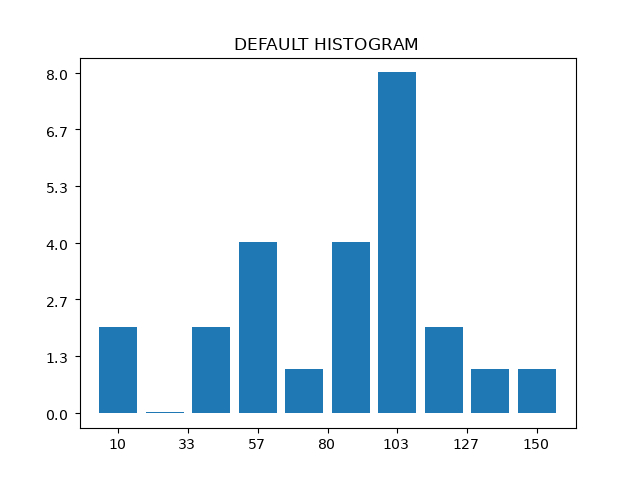
- HISTOGRAM:
You can create an histogram from data.
$graph->hist( $arr_values, $cfg = null );
$cfg['num_blocks] = blocks to divide histogram. Default = 10
Example:
$graph->title( 'DEFAULT HISTOGRAM' );
$graph->hist( [10, 11, 40, 45, 50, 55, 60, 60, 70, 80, 85, 90, 95, 100, 105, 106, 107, 108, 109, 110, 111, 112, 123, 140, 150] );
echo '<img src="'.$graph->output_gd_png_base64( ).'" >'; // Echo img raw data in html page
With this simple code you will generate Histogram Graph:
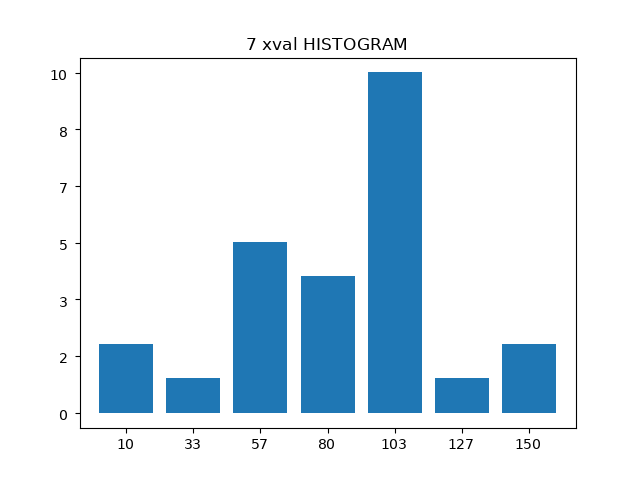
Example of Histogram with 7 blocks:
$graph->title( '7 xval HISTOGRAM' );
$graph->hist( [10, 11, 40, 45, 50, 55, 60, 60, 70, 80, 85, 90, 95, 100, 105, 106, 107, 108, 109, 110, 111, 112, 123, 140, 150], ['num_blocks' => 7] );
echo '<img src="'.$graph->output_gd_png_base64( ).'" >'; // Echo img raw data in html page
With this simple code you will generate Histogram Graph with 7 bocks:
- GET BASE64 IMAGE DATE:
In this earlier version you can get the data in Base64 format and use it directly into html page.
From Version 1.0.1:
- In $cfg you can specify if you want to draw X ticks labels or Y ticks labes with array configuration: [ 'xshowlabelticks' => true, 'xshowlabelticks' => true ].
- In $cfg you can sepecify border type: [ 'bordertype' => 'square' ] or [ 'bordertype' => 'halfsquare' ]. Default is square. Halfsquare normaly used when draw subplots.
- In $cfg you can sepecify the ymarginleftlabel: [ 'ymarginleftlabel' => 1 ]
$graph->output_gd_png_base64( $cfg = null )
Example:
echo '<img src="'.$graph->output_gd_png_base64( ).'" >'; // Echo img raw data in html page
echo '<img src="'.$graph->output_gd_png_base64( [ 'xshowlabelticks' => true, 'xshowlabelticks' => true ] ).'" >'; // Echo img raw data in html page without ticks labels
- SET WIDTH GRAPH:
You can change the default (6.4 inches) width graph in inches
$graph->width( $width = 6.4 );
Example:
$graph->width( 12.8 );
- SET HEIGHT GRAPH:
You can change the default (4.8 inches) height graph in inches
$graph->height( $height = 4.8 );
Example:
$graph->height( 9.6 );
- CFG_GRAPH_TYPES - USING LINES, COLORS & MARKERS:
You can set some types of graphs:
- When prepare a plot, you can to pass a cfg_param with:
'-': Single line
'--': Discontinued line
'bar': Bar
'scatter': Scatter
One of this colors:
['b' => '#0000ff', 'g' => '#008000', 'r' => '#ff0000', 'c' => '#00cccc', 'm' => '#cc0000', 'y' => '#cc0000', 'k' => '#000000', 'w' => '#ffffff',
    '#1f77b4' => '#1f77b4', '#ff7f0e' => '#ff7f0e', '#2ca02c' => '#2ca02c', '#d62728' => '#d62728', '#9467bd' => '#9467bd', '#8c564b' => '#8c564b',
    '#e377c2' => '#e377c2', '#7f7f7f' => '#7f7f7f', '#bcbd22' => '#bcbd22', '#17becf' => '#17becf']
For markers you can to use:
'filename.png' -> Your file name of png of your marker
'o': round marker
'x': X marker
'^': Triangle marker
's': Square marker
'd': Diamond marker
By default, each time that you prepare a values, the system select next color in cycler: cycler' => [
        'color' => [
            'default' => ['#1f77b4', '#ff7f0e', '#2ca02c', '#d62728', '#9467bd', '#8c564b', '#e377c2', '#7f7f7f', '#bcbd22', '#17becf']
            ],
        ],
If you want a special color for one serie, you can to pass it in $cfg var when draw plot(), bar(). See the examples
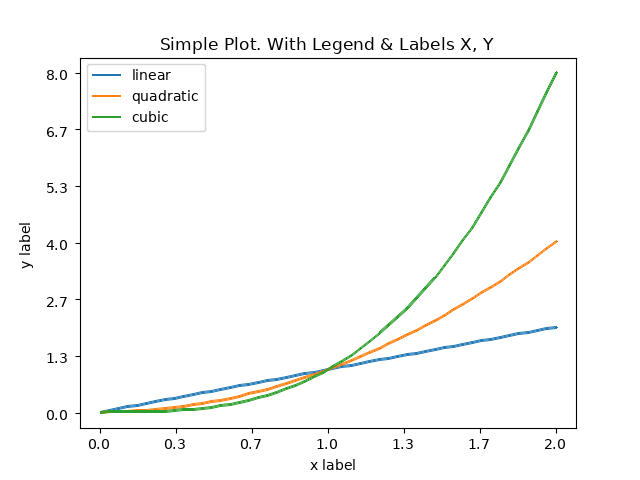
- MATH FUNCTIONS:
$graph->math
This class is provided with the math library ext-op-ml-php (https://github.com/vivesweb/ext_op_ml)
Here is an example of its use. Check the library documentation to see possibilities
Example:
$graph = new graph();
$x = $graph->math->linspace( 0, 2, 50 );
$graph->plot( $x, $x, ['label'=>'linear'] );
$graph->plot( $x, $graph->math->pow($x, 2), ['label'=>'quadratic'] );
$graph->plot( $x, $graph->math->pow($x, 3), ['label'=>'cubic'] );
$graph->xlabel('x label');
$graph->ylabel('y label');
$graph->title("Simple Plot. With Legend & Labels X, Y");
$graph->legend( );
echo '<img src="'.$graph->output_gd_png_base64( ).'" >'; // Echo img raw data in html page
With this simple code you will generate Simple Line graph with Math Functions:
Of course. You can use it freely :vulcan_salute::alien:
By Rafa.
@author Rafael Martin Soto
@author {@link http://www.inatica.com/ Inatica}
@blog {@link https://rafamartin10.blogspot.com/ Rafael Martin's Blog}
@since October 2021
@version 1.0.1
@license GNU General Public License v3.0
| Screenshots (8) | ||


| File | Role | Description | ||
|---|---|---|---|---|
| Icon | Icon image | |||
| Data | Auxiliary data | |||
| Icon | Icon image | |||
| Example | Example script | |||
| Class | Class source | |||
| Lic. | License text | |||
| Data | Auxiliary data | |||
| Data | Auxiliary data | |||
| Icon | Icon image | |||
| Icon | Icon image | |||
| Doc. | Documentation | |||
| Data | Auxiliary data | |||
| Icon | Icon image | |||
| Icon | Icon image | |||
| Icon | Icon image | |||
| Icon | Icon image | |||
| Icon | Icon image | |||
| Icon | Icon image | |||
| Icon | Icon image | |||
| Icon | Icon image | |||
| Icon | Icon image | |||
| Icon | Icon image | |||
| Icon | Icon image | |||
| Icon | Icon image | |||
| Icon | Icon image | |||
| Icon | Icon image | |||
| Icon | Icon image | |||
| Icon | Icon image | |||
| Icon | Icon image | |||
| Icon | Icon image | |||
| Icon | Icon image | |||
| Icon | Icon image | |||
| Icon | Icon image | |||
| Icon | Icon image | |||
| Icon | Icon image | |||
| Icon | Icon image | |||
| Icon | Icon image | |||
| Icon | Icon image | |||
| / | ext-op-ml-php |
| File | Role | Description |
|---|---|---|
| |
Example | Example script |
| |
Class | Class source |
| / | fonts | / | dejavu-fonts-ttf-2.37 |
| File | Role | Description | ||
|---|---|---|---|---|
| |
Data | Auxiliary data | ||
| |
Data | Auxiliary data | ||
| |
Doc. | Documentation | ||
| |
Lic. | License text | ||
| |
Data | Auxiliary data | ||
| |
Doc. | Documentation | ||
| |
Doc. | Documentation | ||
| |
Doc. | Documentation | ||
| / | fonts | / | dejavu-fonts-ttf-2.37 | / | fontconfig |
| File | Role | Description |
|---|---|---|
| |
Data | Auxiliary data |
| |
Data | Auxiliary data |
| |
Data | Auxiliary data |
| |
Data | Auxiliary data |
| |
Data | Auxiliary data |
| |
Data | Auxiliary data |
| / | img2img |
| File | Role | Description | ||
|---|---|---|---|---|
| |
Example | Example script | ||
| |
Class | Class source | ||
| |
Data | Auxiliary data | ||
| |
Icon | Icon image | ||
| |
Icon | Icon image | ||
| |
Icon | Icon image | ||
| |
Data | Auxiliary data | ||
| |
Data | Auxiliary data | ||
| |
Data | Auxiliary data | ||
| |
Icon | Icon image | ||
| |
Icon | Icon image | ||
| |
Data | Auxiliary data | ||
| |
Icon | Icon image | ||
| |
Icon | Icon image | ||
| |
Aux. | Auxiliary script | ||
| |
Data | Auxiliary data | ||
| |
Data | Auxiliary data | ||
| / | img2img | / | PHP-Instagram-effects-master |
| / | img2img | / | PHP-Instagram-effects-master | / | assets |
| File | Role | Description |
|---|---|---|
| |
Data | Auxiliary data |
| |
Icon | Icon image |
| |
Data | Auxiliary data |
| |
Data | Auxiliary data |
| |
Data | Auxiliary data |
| / | img2img | / | PHP-Instagram-effects-master | / | examples |
| File | Role | Description |
|---|---|---|
| |
Example | Example script |
| |
Example | Example script |
| |
Example | Example script |
| |
Example | Example script |
| |
Example | Example script |
| |
Icon | Icon image |
| |
Example | Example script |
| |
Example | Example script |
| |
Example | Example script |
| |
Example | Example script |
| |
Example | Example script |
| |
Example | Example script |
| |
Example | Example script |
| / | img2img | / | PHP-Instagram-effects-master | / | src | / | Image |
| File | Role | Description |
|---|---|---|
| |
Class | Class source |
| The PHP Classes site has supported package installation using the Composer tool since 2013, as you may verify by reading this instructions page. |
| Version Control | Unique User Downloads | Download Rankings | |||||||||||||||
| 92% |
|
|
| Applications that use this package |
![]() If you know an application of this package, send a message to the author to add a link here.
If you know an application of this package, send a message to the author to add a link here.
| Related pages |
| Announcement of graph-php launch |
